Financial Indexes
Introduction of AIDA's Financial Performance
Unit: million yen
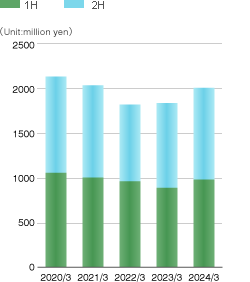
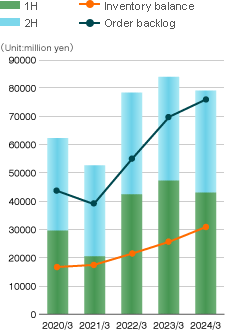
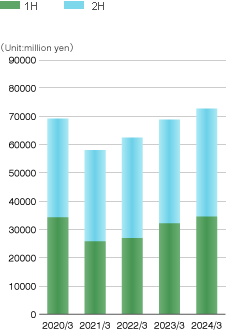
| 2022/3 | 2023/3 | 2024/3 | 2025/3 | 2026/3 | |
|---|---|---|---|---|---|
| Orders | 78,357 | 83,994 | 79,105 | 62,603 | 69,726 |
| Sales | 62,466 | 68,795 | 72,742 | 76,006 | 78,647 |
| Operating income | 2,505 | 1,540 | 3,615 | 5,529 | 5,690 |
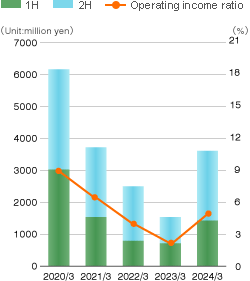
| Operating income ratio | 4.0% | 2.2% | 5.0% | 7.3% | 7.2% |
| Net income attributable to owners of parent | 896 | 1,295 | 2,808 | 5,101 | 4,260 |
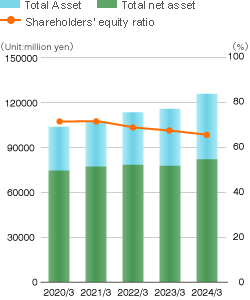
| Total assets | 113,933 | 116,287 | 126,195 | 122,862 | 125,424 |
| Total net assets | 78,664 | 78,043 | 82,321 | 83,637 | 86,658 |
| Shareholders' equity ratio | 68.4% | 67.0% | 65.2% | 68.0% | 69.0% |
| ROE | 1.2% | 1.7% | 3.5% | 6.2% | 5.0% |
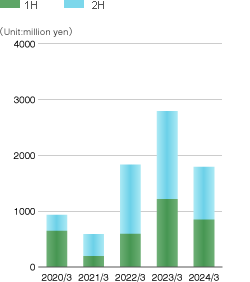
| Capital Expenditure | 1,839 | 2,801 | 1,800 | 1,146 | 1,441 |
| Depreciation | 1,833 | 1,847 | 2,021 | 1,960 | 2,109 |
Orders
Sales
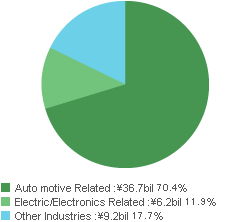
Sales (press machines) by customer industry
2026/3
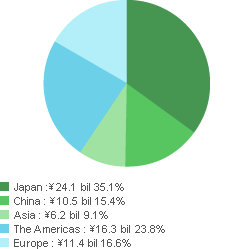
Sales to Third Party (by Geographic segment)
2026/3
Operating income
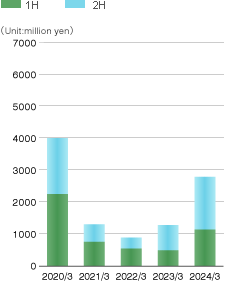
Net income attributable to owners of parent
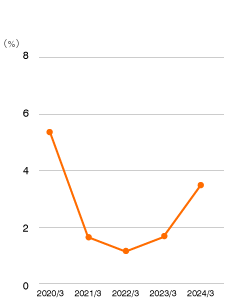
ROE
Total Asset, Net Asset and Shareholders' Equity Ratio
Capital Expenditure
Depreciation